

Introduction
Modern information systems operate with huge amounts of spatial data: object locations, dynamics, and behavior dynamically changing through time. Visual representation of spatially distributed data has a strong influence on their perception and decision-making support.
Существует множество подходов к визуализации геопространственных данных: привязанные к объектам на местности схемы и диаграммы, цветографическое представление атрибутивной информации о геообъектах, тепловые карты. К современным информационным системам, работающим с данными, распределенными на местности, предъявляется требование интеграции представлений об актуальном состоянии ландшафта и самих изучаемых геоданных.
В качестве простого примера пространственно-распределенной информации можно взять обезличенные данные о дорожно-транспортных происшествиях за несколько последних лет. Эти данные представляют собой набор координат (широта / долгота) точек на местности, в которых произошли ДТП. Вся атрибутивная информация о происшествиях (время суток, характеристики участников ДТП, сведения о пострадавших и прочее) была заранее исключена.
For a spatial aggregation of data, GIZMOre/cGIS platform uses the hexagonal grid (Hexagon Layer). When using a grid with cells of this shape, all neighboring hexagons are at the same distance, so hexagons have an advantage over the traditional square grid, in which some cells are further away than others.
Representation of traffic accidents data in cellular structure layers
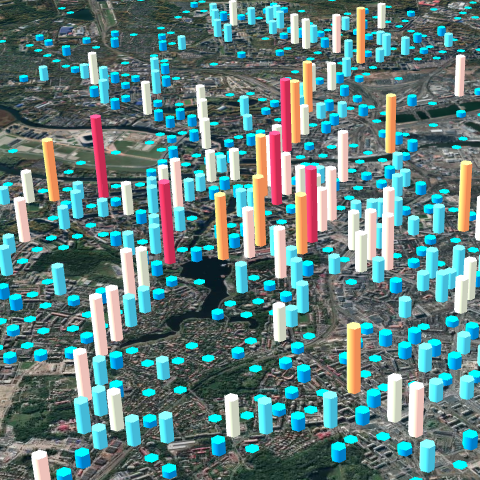
Analytical cellular structure layers (hexagonal cells) allow to visualyl integrate the landscape data with the data under study distributed in the terrain. They allow displaying spatially distributed data, which is a set of coordinates devoid of any attributive information. The analytical layer will perform spatial aggregation of the data and present the result as three-dimensional columns with a cellular base. The height of each column will be proportional to the number of points on the map that fall into its base.
Such a representation is very convenient for quick qualitative data evaluation. By changing the observer position and the data analysis and aggregation parameters, one can quickly identify problem areas of the transport network to proceed to a more detailed analysis later.
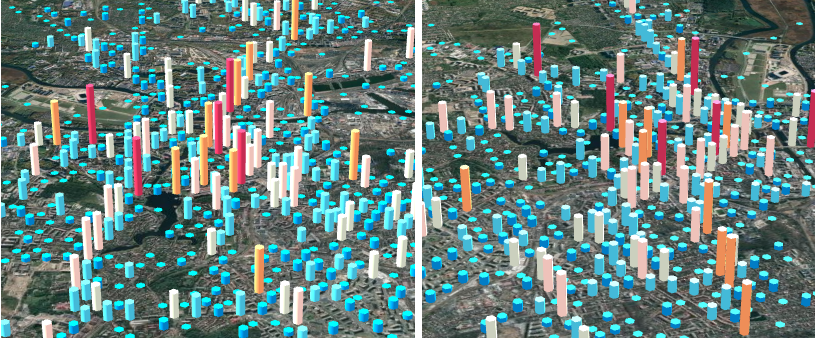
When working with layer data, the user can change the view by operating the observer's position as well as its viewing angle and elevation over the landscape with the mouse.

The Layer Parameters function panel allows the user to specify various data analysis parameters.

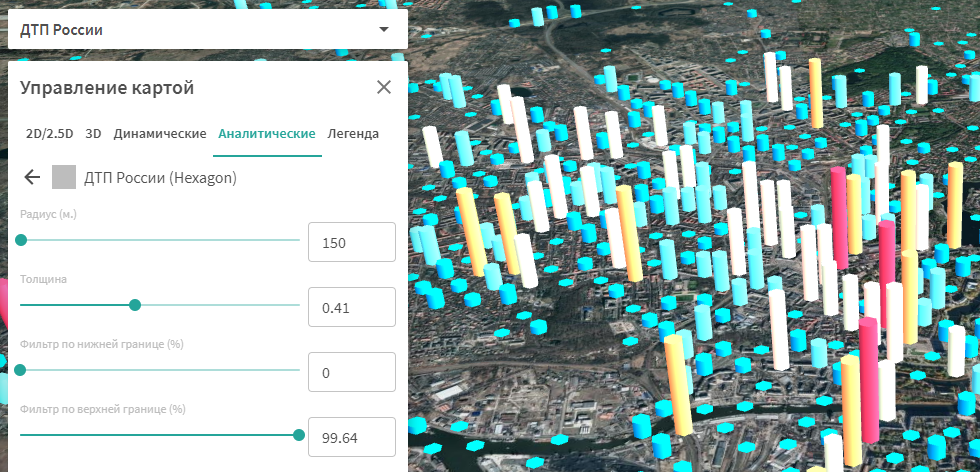
Параметр “Радиус” позволяет задать ширину основания ячеек, которые будут покрывать исследуемую территорию. Чем больше точек на карте попадет в ячейку, тем больше окажется ее высота в визуальном представлении.
Параметр “Толщина” влияет на толщину визуального представления столбиков, которые отображают исследуемые данные. Изменяя этот параметр можно добиться более оптимального, с точки зрения эстетики, вида.
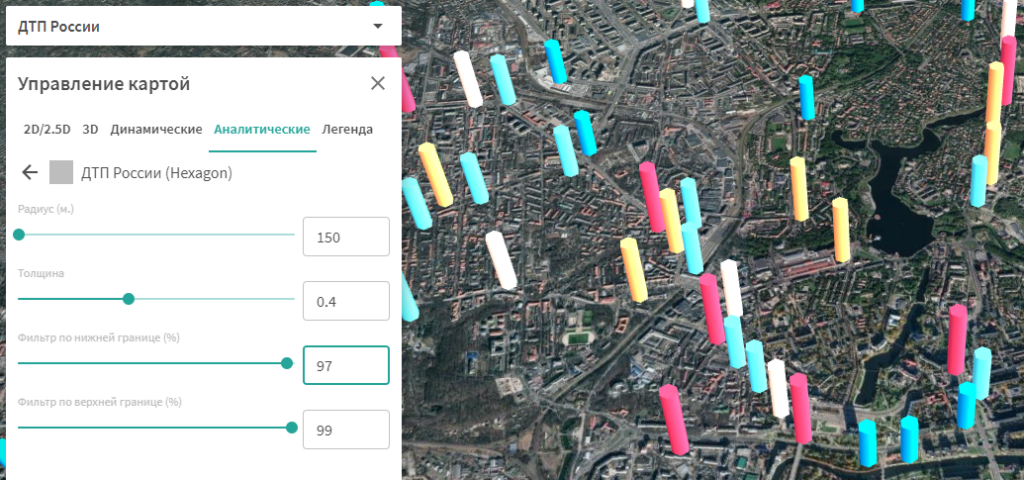
Параметры “Фильтр по нижней границе” и “Фильтр по верхней границу” позволяют произвести отсечку данных по результатам агрегирования. Изменяя значения этих параметров, можно скрыть малозначимые для визуального представления данные, либо отобразить те из них, которые удовлетворяют интересуемому диапазону распределения.
Visual analysis of traffic accident data on a layer
Qualitative visual analysis of data on the analytical layer allows you to see in which parts of the urban landscape traffic accidents occur most often. For example, it is possible to identify areas where the number of accidents is higher than the average for the transport network.

Более детальный анализ данных о дорожно-транспортных происшествиях доступен на слоях визуализации, которые поддерживают анализ геоданных, содержащих атрибутивную информацию.