Introduction
Modern information systems operate with huge amounts of spatial data: object locations, dynamics, and behavior dynamically changing through time. Visual representation of spatially distributed data has a strong influence on their perception and decision-making support.
There are many approaches to the visualization of geospatial data: georeferenced diagrams and charts, chromatic representation of attributive information about geo-objects, heat maps. For modern information systems working with data distributed on the ground, there is a requirement to integrate representations of the actual state of the landscape and the geodata understudy themselves.
As a simple example of spatially distributed information, we can take anonymized data on traffic accidents over the past few years. This data is a set of coordinates (latitude/longitude) of points on the ground where accidents occurred. All attributive information about the accidents (time of day, characteristics of the accident participants, information about the victims, etc.) was excluded in advance.
For a spatial aggregation of data, GIZMOre/cGIS platform uses the hexagonal grid (Hexagon Layer). When using a grid with cells of this shape, all neighboring hexagons are at the same distance, so hexagons have an advantage over the traditional square grid, in which some cells are further away than others.
Representation of traffic accidents data in cellular structure layers
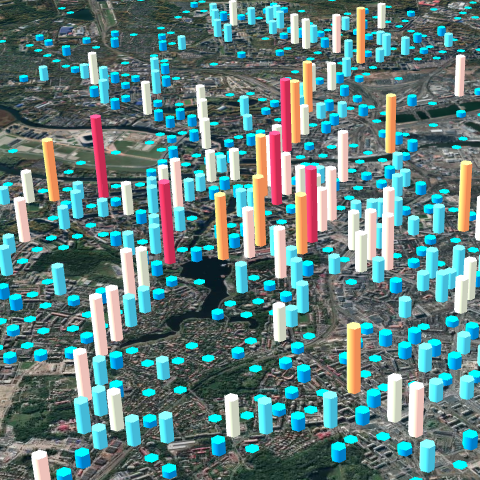
Analytical cellular structure layers (hexagonal cells) allow to visualyl integrate the landscape data with the data under study distributed in the terrain. They allow displaying spatially distributed data, which is a set of coordinates devoid of any attributive information. The analytical layer will perform spatial aggregation of the data and present the result as three-dimensional columns with a cellular base. The height of each column will be proportional to the number of points on the map that fall into its base.
Such a representation is very convenient for quick qualitative data evaluation. By changing the observer position and the data analysis and aggregation parameters, one can quickly identify problem areas of the transport network to proceed to a more detailed analysis later.
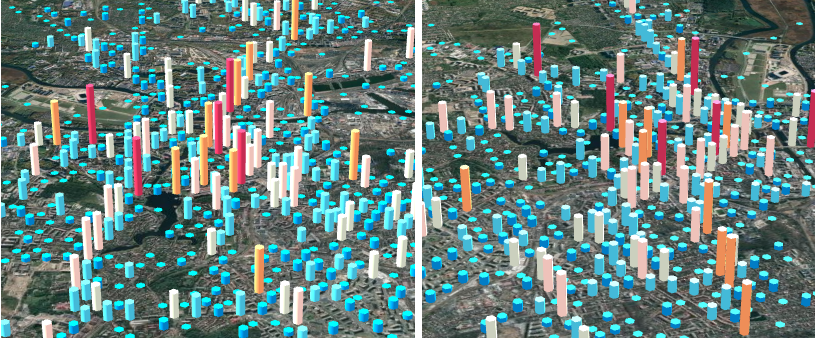
When working with layer data, the user can change the view by operating the observer's position as well as its viewing angle and elevation over the landscape with the mouse.
The Layer Parameters function panel allows the user to specify various data analysis parameters.
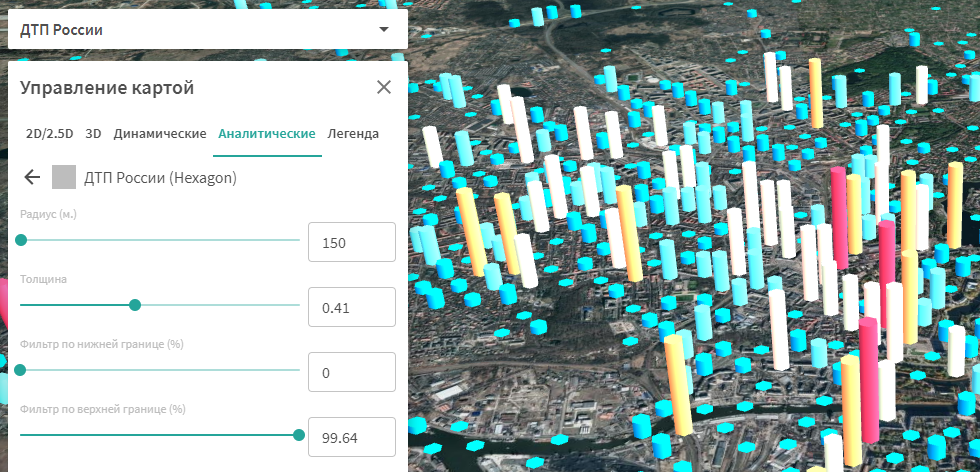
The "Radius" parameter allows you to set the width of the base of the cells that will cover the studied area. The more points on the map fall into a cell, the greater will be its height in the visual representation.
The "Thickness" parameter affects the thickness of the visual representation of the bars that display the data under study. By changing this parameter, you can achieve a more optimal, in terms of aesthetics, view.
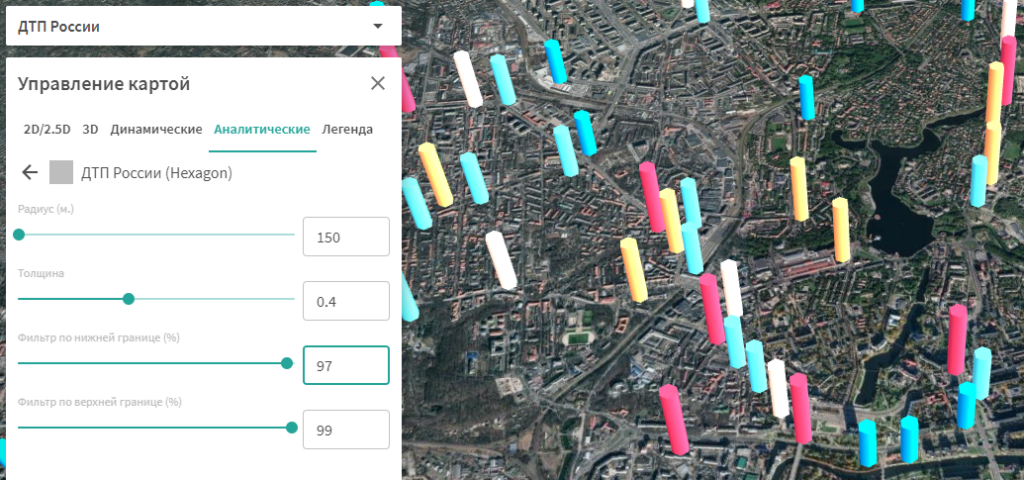
The "Lower Bound Filter" and "Upper Bound Filter" options allow you to separate the data from the aggregation results. By changing the values of these options, you can hide data that is not visually relevant, or display data that corresponds to the range of interest of the distribution.
Visual analysis of traffic accident data on a layer
Qualitative visual analysis of data on the analytical layer allows you to see in which parts of the urban landscape traffic accidents occur most often. For example, it is possible to identify areas where the number of accidents is higher than the average for the transport network.
More detailed analysis of traffic accidents data is available on visualization layers that support analysis of geodata containing attribute information.